Overview and data download
Nearly all of California’s state waters have been mapped using multibeam sonar.
We provide a comprehensive GIS raster data file merging data from three sources:
- Detailed 2m resolution data for the northern Channel Islands (not available online)
- CDFW Marine Region GIS Data Website (see hab_ca_predictedsubstrate_wz.zip)
- CDFW GIS Maps & Data hosted by Stanford Libraries: Southern, Central, Northern (data from the North Central region is missing from this resource)
Our merged raster is available for download below:
| Data | UTM | WGS 84 |
| 10m bottom substrate | CA_bottom_substrate_10m.zip | CA_bottom_substrate_10m_wgs84.zip |
Maps and visuals
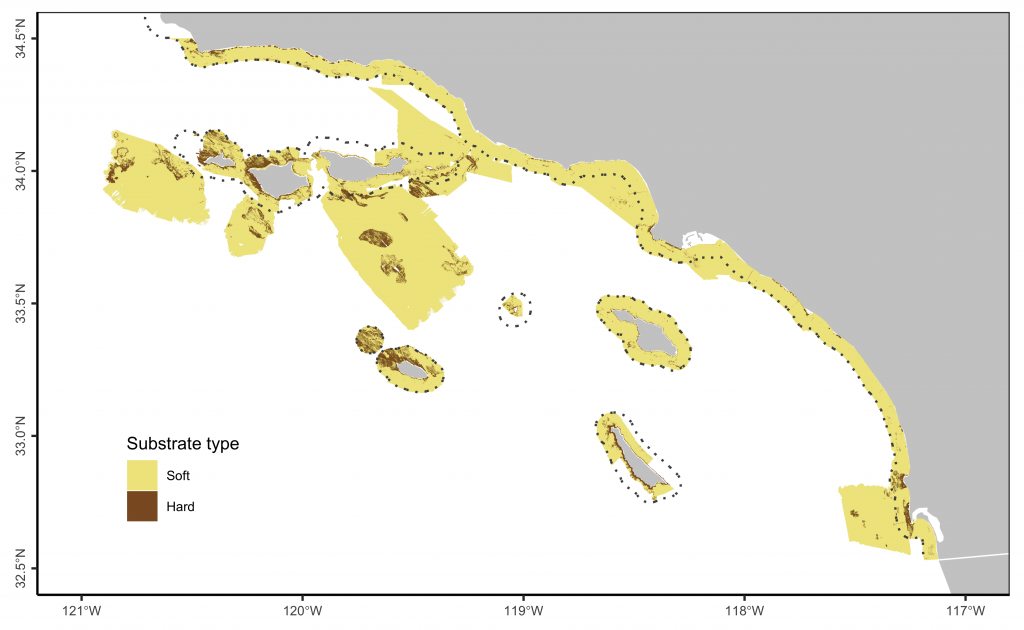
The figure below illustrates bottom substrate coverage in Southern California mapped using our comprehensive raster file:
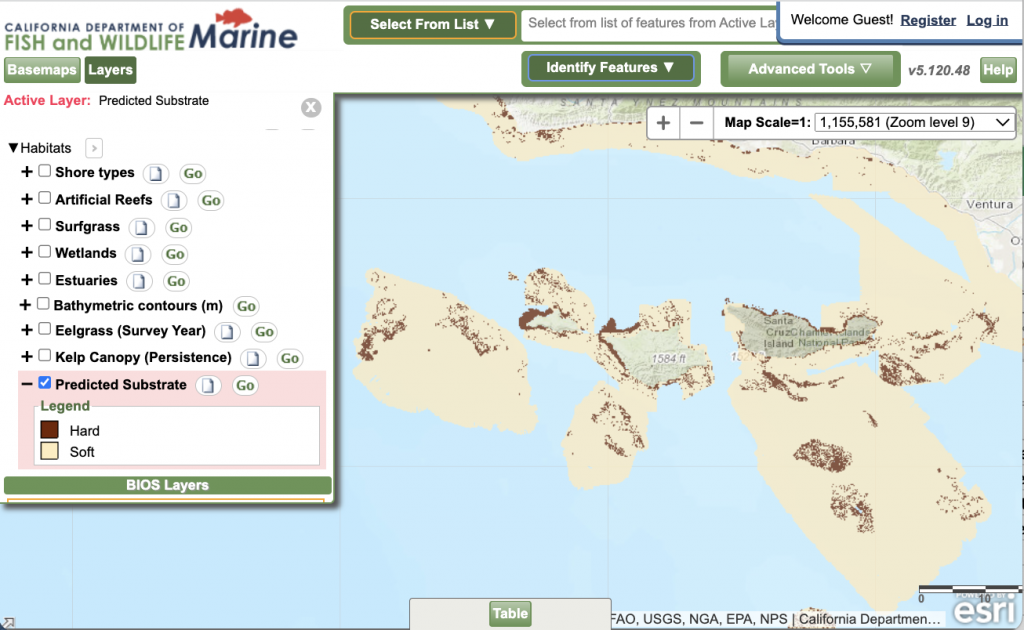
A portion of these data can be visually explored in the CDFW MarineBIOS Data Explorer by selecting “Habitat” then “Predicted Substrate”.
Example application: Bottom substate in California’s MPAs
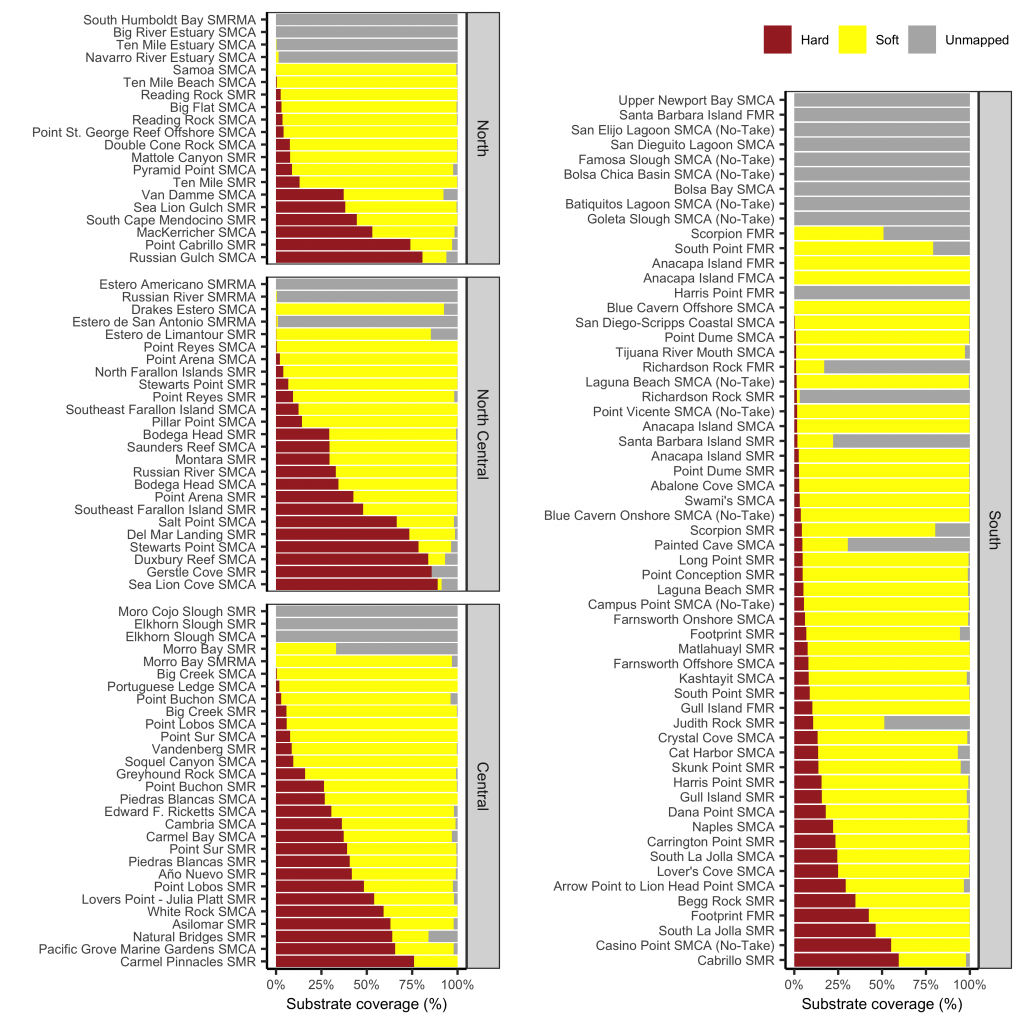
The figure below uses these data to illustrate the proportion of California’s MPAs that are covered in hard or soft substrate or that are unmapped. MPAs are grouped by region and sorted in order of increasing hard substrate coverage. Maps of substrate coverage in California’s MPAs can be further explored in this interactive RShiny web application: https://emlab-ucsb.shinyapps.io/ca_mpa_habitats/
Data formatting summary
We merged the following three sources of bottom substrate data, listed in order of preference, to generate a comprehensive map of bottom substrate coverage:
- Northern Channel Islands Data: Detailed 2m resolution bottom substrate data for the northern Channel Islands (not available online)
- Statewide Data from CDFW: CDFW Marine Region GIS Data Website (see hab_ca_predictedsubstrate_wz.zip)
- Near-Statewide Data from Stanford Libraries: CDFW GIS Maps & Data hosted by Stanford Libraries: Southern, Central, Northern (data from the North Central region is missing from this resource)
The Northern Channels Islands data were provided by the Channel Islands National Marine Sanctuary (CINMS) and provide greater coverage around the Northern Channels Islands than the other two datasets. These data map substrate as a 2 m resolution raster.
The statewide substrate data published on the CDFW Marine Region GIS Data website provides the data as a polygon shapefile. These data can be viewed in the CDFW MarineBIOS Data Explorer by selecting “Habitat” then “Predicted Substrate”.
The Stanford Library provides substrate data for three of four regions as polygon shapefiles. We merged the three regional polygons into a single polygon shapefile before merging data across all three sources.
We merged data across all three sources in a three step process. First, we converted the Northern Channels islands raster data to a polygon shapefile to ease merging with the other data sources. Second, we merged the three sources into a single polygon shapefile and added a “priority” attribute to indicate the following data preference: (1) Northern Channel Islands (highest priority=3); (2) CDFW data (middle priority=2), and (3) Stanford data (lowest priority=3). We then rasterized this polygon to 10 m resolution using the value from the highest priority dataset when values are available for multiple datasets.
The raster file is much smaller and easier to use than the merged polygon file.
Original data creation
These data were gathered through a comprehensive state waters mapping program managed by the California State Coastal Conservancy, Ocean Protection Council, California Department of Fish and Game, and the NOAA National Marine Sanctuary Program. The goal of this program was the creation of high-resolution 1:24,000 scale geologic and habitat maps covering all of California’s 14,500 km2 state waters out to the 3 mile limit.
The benthic substrate classifications were not derived through traditional geologic interpretations, but were algorithmically defined using seafloor roughness (rugosity analysis) as a proxy for determining areas likely to consist of rocky reef with significant relief (“hard substrate”) and sandy bottoms with lower relief (“soft substrate”). This method is used for the practical purposes of broadly generalizing habitats for MPA planning and expedient delivery of information to the MLPA Initiative process. For the sake of simplicity, the categories are called “hard” and “soft”, however the limitations of the classification methods should be considered when using these terms.
Data gaps in the shallow “white zone” were filled using an Inverse Distance Weighting (IDW) process with a power of 0.5 with 30 m pixels. The interpolation was made between linear shoreline data classified from NOAA Environmental Sensitivity Index (ESI) data and the subtidal seafloor mapping data used to classify the offshore area. Areas in federal waters were added with data contributed by NOAA and USGS.
The results may be confounded by factors including noise and artifacts from the original mapping data, steep slopes, and unusual geomorphic features. One consideration is that some areas where rocky bottom occurs may be underestimated by the “rough” category, including canyon slopes, deep water, and rock that is smooth, plateau-like, and/or lightly draped with sediment.