The purpose of this guide is to orient scientists and other data users to California’s CPFV logbook data. These data are confidential and are only provided through authorized data sharing agreements. This guide seeks to help scientists and other data users anticipate how these data are formatted and how they may have to “clean” (a.k.a., process) the data before they can be used in analysis. I also seek to highlight special tricks and caveats gleaned from my experience using the data. Ultimately, I hope this guide will help clarify what data are available and how these data can be processed to maximize their utility.
Overview
The California Department of Fish and Wildlife (CDFW) has been compiling catch statistics on California’s fisheries since 1916. CDFW began monitoring California’s Commercial Passenger Fishing Vessel (CPFV) fleet in 1936. CPFVs are for-hire fishing boats (also known as “party boats”) of various sizes that take recreational anglers fishing. Every month, CPFV vessels are required to submit logbooks documenting the effort and harvest of each trip taken that month. In general, the logbooks document where fishing occurred (i.e., block id, depth), how much fishing occurred (i.e., number of anglers, duration of fishing), and how much fish were caught and/or released. Additionally, they include information on what species were targeted, what fishing methods and bait were used, and whether there were interactions with birds or sea lions.
An example logbook is available here. Additional information is available here.
This guide provides an overview of California’s CPFV logbook data based on a data request processed in August 2022 for all CPFV logbooks from 2000-2020. In this guide, I review the attributes of the CPFV logbook data, the steps required to clean the raw data, and some visualizations of non-confidential summaries of the CPFV data.
Data attributes
The CPFV logbook data includes the following columns:
| Column name | Description |
| SerialNumber | Logbook id |
| LogDate | Date |
| LogMonth | Month |
| LogDay | Day |
| LogYear | Year |
| VesselID | Vessel id |
| VesselName | Vessel name |
| PortCode | Port code |
| NoActivityMonth | Was this a month with no fishing activity (Y/N)? |
| TargetSpeciesXXXXX | Salmon, rockfishes, lingcod, striped bass, sturgeon, sharks, tuna, other |
| FishingMethodXXXXX | Trolling, mooching, anchored, drifting, diving, other |
| BaitUsedXXXX | Anchovies, sardines, squid, other – with options for live or dead |
| TripType | Type of trip (single day, multi-day, both) |
| NonPaying | Was this a trip with non-paying customers (Y/N)? |
| BirdInteraction | Was there an interaction with birds (Y/N)?* |
| DescendingDevice | Was a descending device used (Y/N)? |
| Block | Block id |
| DepartureTime | Departure time (HH:MM) |
| ReturnTime | Return time (HH:MM) |
| HoursMinutesFished | Hours fished (HH:MM) |
| HoursFished | Hours fished (numeric) |
| NumberOfFishers | Number of fishers (includes crew) |
| Depth | Depth (ft) |
| Temperature | Temperature (°F) |
| SpeciesCode | Species code |
| Species | Common name |
| NumberKept | Number of fish kept |
| NumberReleased | Number of fish released |
| NumberLostToSeaLions | Number of fish lost to sea lions |
| NumberOfFishCaughtByCrew | Number of fish caught by crew |
| NumberOfCrewFished | Number of crew who fished |
| OperatorName | Operator name |
| DateReceived | Date logbook received |
| DateSubmitted | Date logbook submitted |
* Bird interactions consist of birds eating chum, bait on a hook, or the hooked fish.
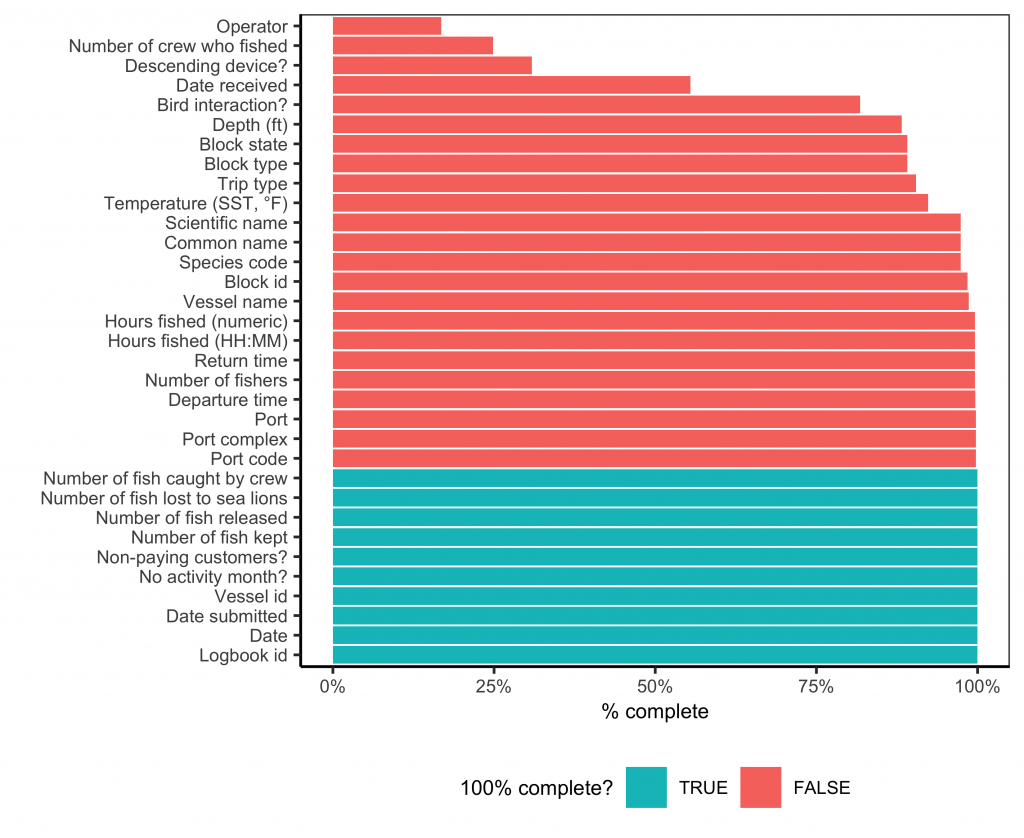
The figure below illustrates the percent completeness of the CPFV logbook data.
Attribute information and issues
Logbook id
The logbook id (“SerialNumber”) is intended to be a unique identifier of each logbook and is supposed to uniquely identify each trip. However, there are typos or other types of mistakes that lead to the same logbook id being used for entirely different vessels on entirely different days. If you have access to this data and want an example, look at logbook id “N332433”.
I create my own unique identifier that combines the logbook id with the vessel id and date of fishing (i.e., N12345-12345-YYYY-MM-DD). This reduces the number of non-unique vessel ids but does not erase the problem entirely. Eliminating this problem requires making corrections to trip meta-data, deleting duplicated logbook entries, and other edits. Proceed carefully.
Vessel id, vessel name, operator name
The vessel id (“VesselID”) information is complete but the vessel name (“VesselName”) information is not. While vessel id is a sufficient unique identifier for most analyses, the absence of vessel names coil limit the ability for users to link datasets in which the vessel name is the only available identifier (i.e., vessel id not provided). The operator name (“OperatorName”) is not remotely harmonized, which is probably fine for most analyses.
Port code
The port of landing is identified using a 3-number code (“PortCode”). I provide a key to relate these codes to their names and complexes here.
The following port codes occur in the data but not in the key and are therefore either typos or ports not identified in the key:
- Unmatched port codes: 21, 55, 77, 280, 421, 714, 718, 719, 826, 4256, 4525, 6069, 8693, 44196, 2282015, 8312014
Please let me know if you know what ports these codes correspond to.
Species code and species name
The species code (“SpeciesCode”) provides a unique identifier for each species. I provide a key to relate these codes to species common names and scientific names here.
Oarfish (Regalecus glesne) does not have a species code in the data or in the key. Furthermore, the following codes occur in the data but not they key and therefore either typos or species not identified in the key:
- Unmatched species codes: 0, 25, 29, 114, 126, 127, 511, 2665, 8/0
Please let me know if you know what species these codes correspond to.
Although the “Species” column provides the common name of the species, it is not well formatted. For example, it sometimes provides species codes instead of common names and the formatting of common names is inconsistent across and within species. I strongly encourage users to use this species key as the source of the common names.
Block id
The block id (“Block”) column identifies the block “where most of the fish were caught or, if no catch was made, where most of the fishing took place.”
I strongly encourage users to use the block shapefile provided here to map these locations.
Some of the block ids are not valid block ids. These block ids are either typos, not included within the block key, or they are unofficially used generic blocks.
As to the last category, it is common for operators to use rounded block ids (e.g., 100, 200, 300, etc.) to report that fishing occurred in one of the blocks within that set of 100 ids (e.g., 100 = 100-199, 200=200-299, etc.). However, these block ids could also be typos. Any analysis should be clear about assumptions involving these blocks.
The CPFV data that I received include the following invalid block ids:
- Potential generic blocks: 100, 200, 300, 400, 500, 600, 700, 800, 900, 1100
- Potential typos: 0, 3, 4, 16, 23, 24, 44, 60, 85, 150, 302, 303, 304, 305, 306, 308, 325, 429, 454, 463, 495, 499, 571, 575, 698, 778, 792, 794, 797, 898
- Mexico blocks: 901, 902, 903, 904, 910, 911, 912, 913, 914, 917, 918, 920, 921, 922, 923, 924, 926, 928, 929, 930, 931, 932, 936, 938, 940, 941, 942, 944, 946, 948, 950
I have not received a shapefile mapping Mexico’s block (the 900 blocks) from CDFW and thus cannot map catch occurring in these blocks.
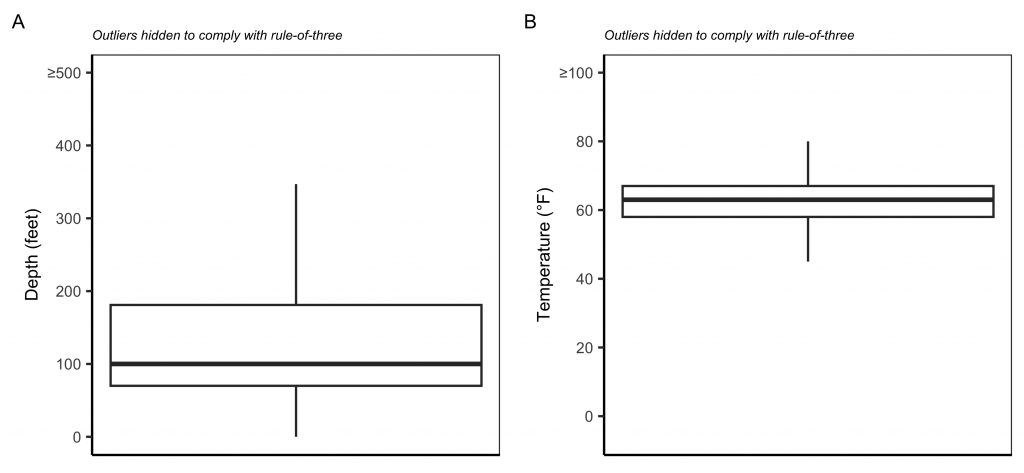
Depth and temperature
CPFV operators are asked to report depth in feet (ft) (“Depth”). The majority of fishing is reported to have occurred between 75-275 feet though much deeper depths are reported. I have yet to rigorously explore whether these depths are plausible given the reported block id. A few negative depths were made positive.
CPFV operators are asked to report sea surface temperature (SST) in degrees Fahrenheit (°F) (“Temperature”). While most of the data are reported within a reasonable SST range (55-65°F), some of the reported temperatures are too hot/cold to be realistic. It is unclear to me how reliable this column is. For example, what is the risk that operators recorded air temperature?
Number of hours fished
The hours fished are reported in two different formats: hours-minutes (e.g., HH:MM) (“HoursMinutesFished”) and decimal hours (e.g. H.HH) (“HoursFished”).
The hours-minutes column is more complete than the decimal hours column and I strongly encourage users to convert it to numeric to maximize the amount of usable effort data.
Unfortunately, a few of the “HoursMinutesFished” are missing colons and a fourth digit. Because we cannot tell if the missing zero is on the left or right (or if it is even a zero that is missing), I have opted to replace these values with NAs.
- Incorrectly formatted durations: 800, 100, 145, 600, 300, 830, 730, 330, 251, 615
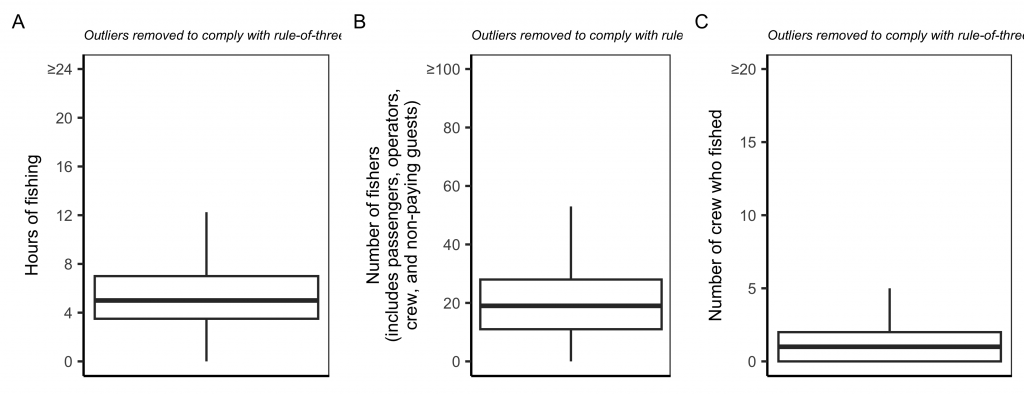
Number of fishers
CPFV operators are required to report the number of crew who fished and the total number of people who fished, which is supposed to include the crew. Thus, the number of fishers who fished is supposed to always exceed the number of crew who fished. However, this is often not the case, and I’m a little skeptical of the reporting for the number of crew who fished. Additionally, both numbers are sometimes very high (>100 fishers) and analyses should carefully consider the validity of these high values.
Number of fish caught, released, eaten by sea lions
I make the assumption that NAs in these columns are actually zeroes.
Data illustrations
The bars in the figure below illustrates the total number of fish caught and released by the CPFV fleet from 2000-2020 based on the logbook data. This figure is reassuring because the black line shows reported CPFV landings from California’s non-confidential data summaries, which were digitized by Free et al. (2022) and shared in the wcfish R package. It’s nice to see general agreement between both data sources.

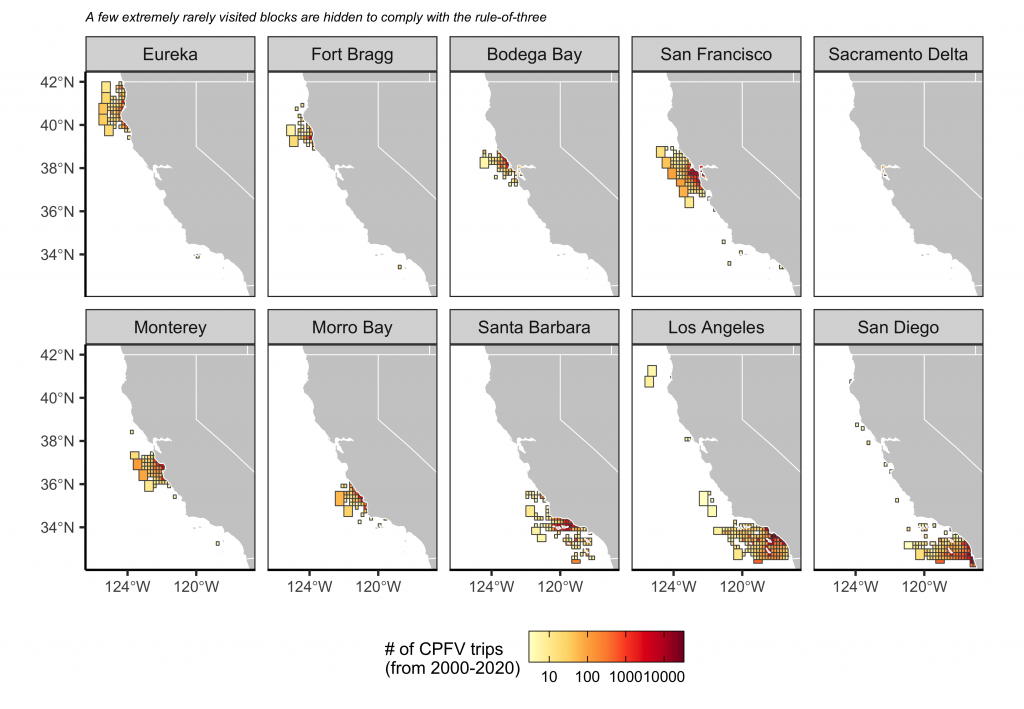
The figure below illustrates the number of CPFV trips taken by vessels from each port of landing. This shows some of the nice spatial properties of the data.
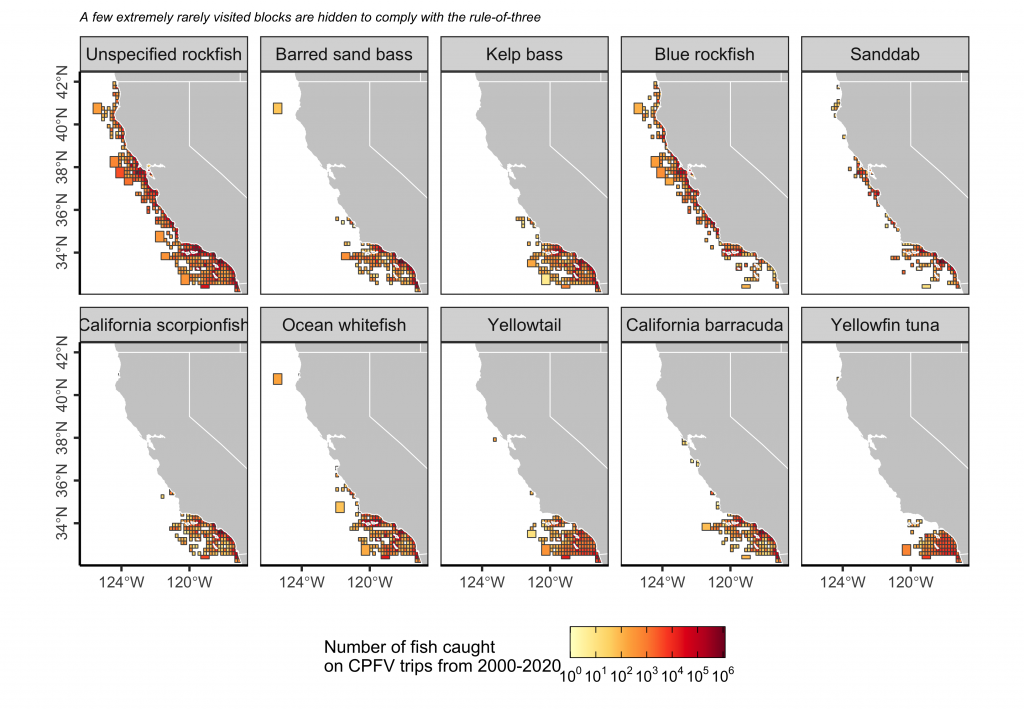
 The figure below illustrates the total number of fish kept on CPFV trips from 2000-2020 for the top-10 species occurring in the data. This shows some of the nice spatial properties of the data.